Double Bottom
References
Overview
- Double bottom Pattern is developed by William Jiler
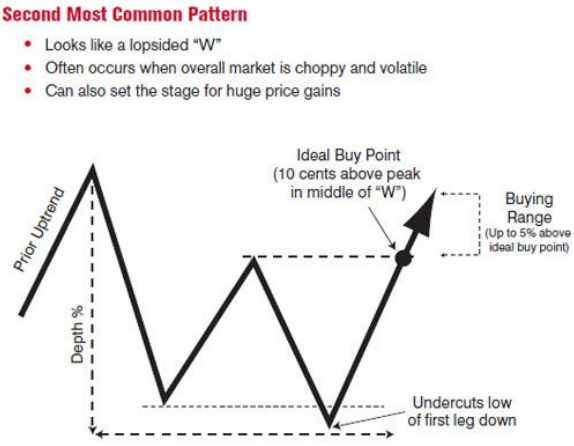
- Looks like lopsided W
- It represent a fake downtrend signal that becomes corrected very quickly and leads to FOMO buying and stock moving up quickly
- Mirroring the Market: Double bottoms tend to form while the overall market is volatile, and that's reflected in the shape
- You have one down leg, then the stock tries to rally but hits resistance and ends up pulling back to form a second down leg
- The stock rebounds one more time and is finally able to punch through and move higher
- The breakout typically occurs when the overall market has also bounced back from a correction into a new uptrend
When to Enter
When to Exit
Chart Samples